
Customizing the FREEBOARD Dashboard
Among the several IoT dashboard solutions available, FREEBOARD is the best compromise in terms of ease of use, rapid set up and look. The proof of this are the several implementations and integrations visible on the web. However it has been built over time with several JQuery libraries, probably in the attempt to add quickly some nice functionalities. With this approach, the downside are the many little glitches and many little bugs, that plague the application.
Poor documentation is also a drawback that will increase headaches in trying to dig in the code for extending it of simply try fixing it.
As many other projects with a similar gestation, it is expected that sooner o later a major redesign or overhaul will happen fixing most of the known problems and creating new, of course, but this is they way it works.
Despite this, FREEBOARD has many advantages for a casual user: It fast and easy to set up, adding widgets to the dash is really a snap and the usability is fair to good. If anybody need to put together few charts and gauges, FREEBOARD is unbeatable, but as soon as the dashboard’s complexity goes beyond than the basic level, then the glitches will become sensible and the advantages will quickly fade.
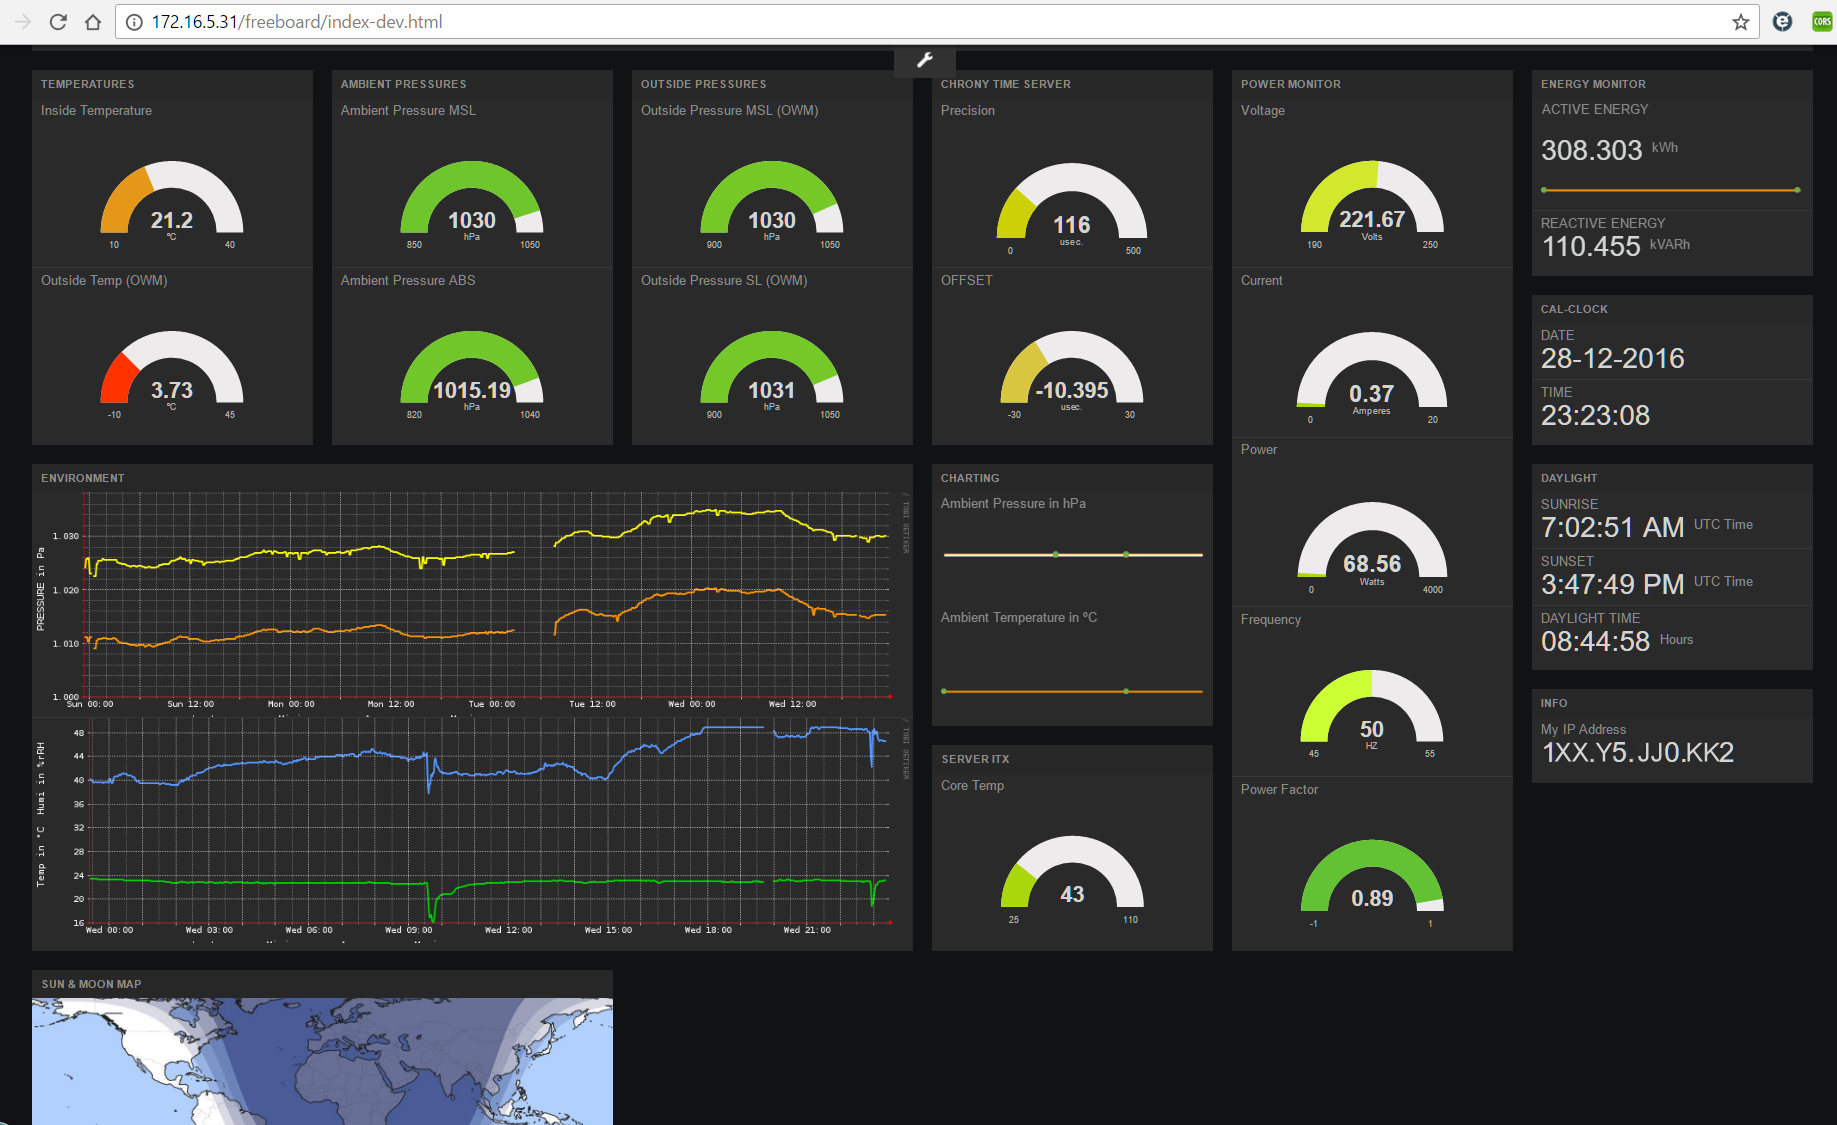
In the dashboard pictured here below, the dashboard shows several gauges connected to Arduino and Raspberry PI sensors (Air Pressure, Temperatures, Humidity, Energy & Power, local GPS Time server, as well as some public REST API websites.
Initial Dashboard JSON Configuration File
With such a configuration, keeping the widget aligned, upon reloads of the configuration is impossible. Sometimes the workaround of reloading the configuration twice can help, but often not. Fiddling with the JSON configuration files wouldn’t help much either and the frustration level will raise, up to the point of dropping the project.
If the scenario I described so far resemble your experience, well don’t give up, there are ways to make things works smoothly enough.
In the following paragraphs and the subsequent pages, you will find some, hopefully useful, tips and tricks.
The IoT System Concepts and Objectives
The IoT System example referred here through is based on the concept of having a localized architecture, keeping the need to access cloud applications to the minimum. The main goals and objectives of this system are:
- Minimize budget for the hardware.
- No budget needed/allowed for paid services.
- Keep new code development to the minimum.
- Use and integrate functionalities of existing software and applications.
- Minimize the use of PHP, Perl, Python,, Ruby etc.
- Favoring the use of bash scripts and linux cli tools.
- Avoid where possible to rely on SQL databases.
- Keep integration, implementation, administration and control of the system as much easy as possible.
- Being able to administer the system from the least possible differnt interfaces/applications.
The IoT System Architecture
The system in this example is made up of the following hardware components:
- IoT Sensors connected to Arduino or Raspberry PI boards and its clones
- A small Linux Server, based on Ubuntu, Debian or alike
- Quad Core J1900 Intel x86 Processor.
- Mini-ITX Motherboard, such as the ASRock Q1900-B-ITX.
- SSD & HARD Disks with advanced file systems like btrfs or zfs
- Client Devices for accessing information, such as PCs, Tablets or Smartphones.
The software and the applications are:
- Operating Systems:
- Ubuntu or Mint 64 bit (amd64) Linux distros for the server.
- Ubuntu Mate or Raspbian 32 bit (armhf) Linux distros for the RasPI boards.
- Middleware:
- Webmin administration system.
- Webinstats (aka sysstats) for Webmin
- RRDTool (Round Robin Database) and its tools for collecting and graphing data.
- VirtualBox as the main VMs hypervisor for the server.
- LXC / LXD containers for container virtualization on the Raspberries.
- Apache2 or nginx Web servers or any lighter webserver capable to serve cgi-bin scripts and executables.
- Chrony for network time serving (much better than NTP).
- Applications:
- Freeboard.
System Implementation
Documenting the installation of the operating system and middleware is beyond the scope of this page, but to define the baseline the server and the Raspberries shall have installed , at minimum, the linux operating system, webmin and webminstats, a web server with cgi-bin capabilities.
After having installed the operating systems and middleware,on the different hardware the sensor hardware and software can be set up by following these indications and tutorials:
- RasPI with Chrony and GPS – use these tutorials:
- Ambient sensors:
- Assuming (for the moment) the sensors are already installed and functioning.
- Make sure the Sensors can provide JSON Output
- Installing Webmin, webminstats and RRDTool:
- Collect sensor data through Webmin
- webminstats data is available in RRD files
- sensor data can be collected in webminstats RRD files cloning and configuring the “custom” webminstats module.
At this point it is presumed that you have your hardware running, webmin is collecting data on the relevant hardware and you are ready to install freeboard.
Installing FREEBOARD
Install FREEBOARD via git from the GIT HUB FREEBOARD site, by cloning it in the base directory of your web server (usually /var/www/…) and execute the following commands
cd /var/www/html
git clone https://github.com/Freeboard/freeboard.git
cd ./freeboard
npm install
grunt
You may need to resolve some dependencies by hand but in most cases it should work seamlessly. Now point your browser to:
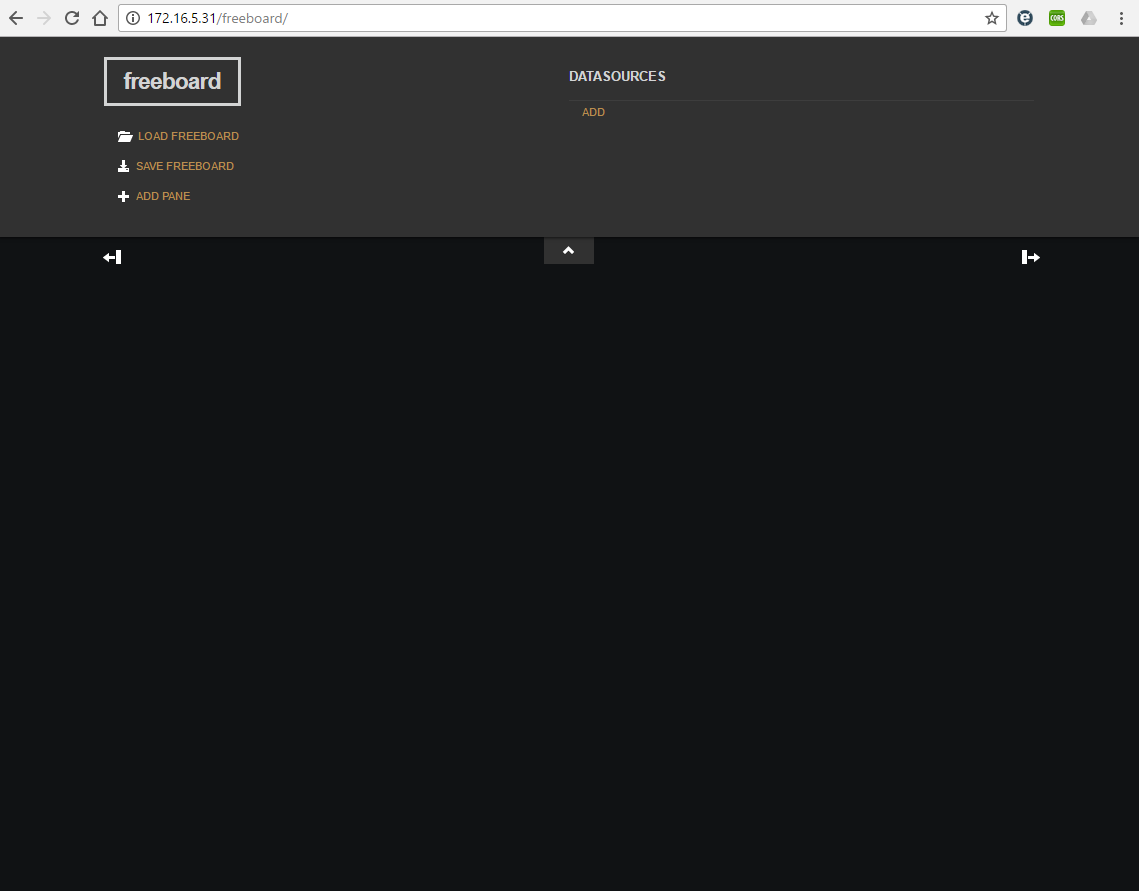
http://[your.server.IP.Address]/freeboard
or
http://[your.server.IP.Address]/freeboard/index.html
or
http://[your.server.IP.Address]/freeboard/index-dev.html
and you should see a page like this:
TAMING the BEAST
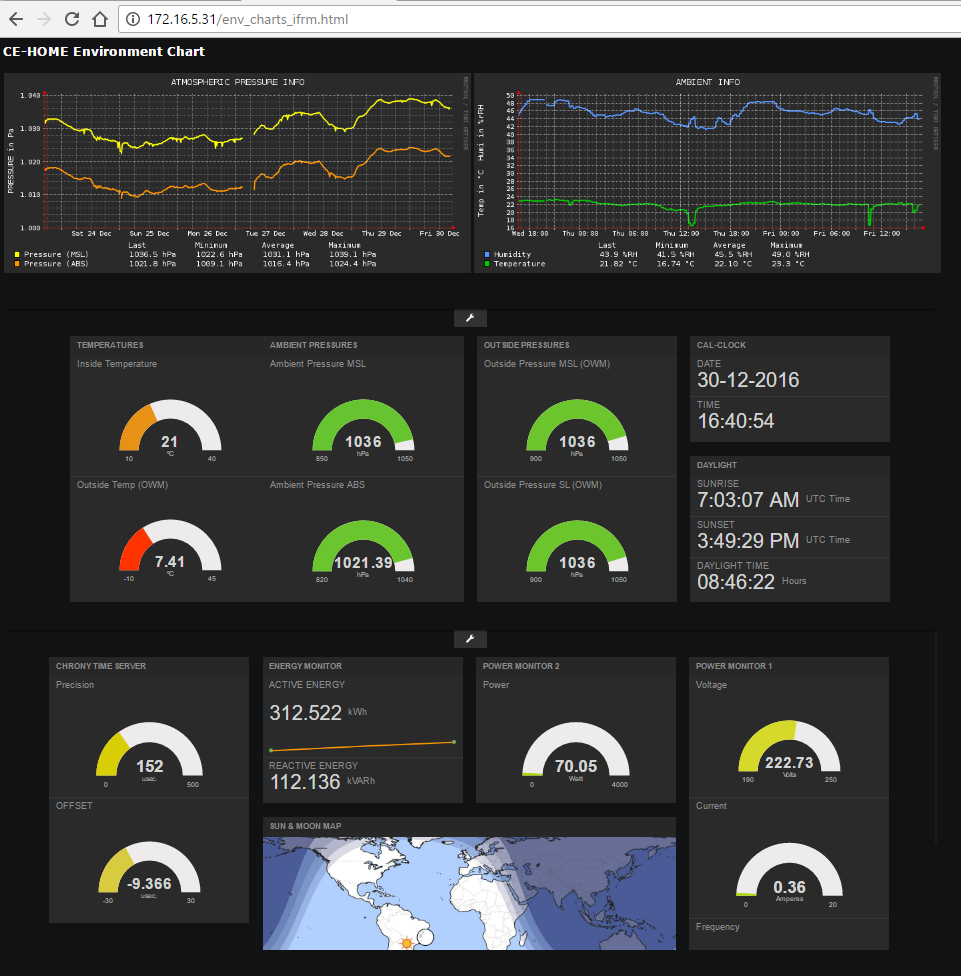
By noticing that most of the FREEBOARD glitches are less sensitive if the number of widgets is below ten, the first trick to play is to create a landing page in HTML 5 and by using IFRAMES to create several instances of FREEBOARD, each of them with a limited number of widgets, such as this:
and this is its HTML code:
<HTML>
 <HEAD><TITLE>CE-Dashboard</TITLE>
<!--   <meta http-equiv="refresh" content=”120" /> -->
<style>
body {
    background-color: #101214;
}
h1 {
    color: white;
    text-align: left;
    font-family: verdana;
}
h2 {
    color: white;
    text-align: left;
    font-family: verdana;
}
h3 {
    color: white;
    text-align: left;
    font-family: verdana;
}
h4 {
    color: white;
    text-align: left;
    font-family: verdana;
}
a {
    color: white;
    text-align: left;
    font-family: verdana;
}
p {
    font-family: verdana;
    font-size: 20px;
}
</style>
</HEAD>
 <BODY>

<h3>CE-HOME Environment Chart</h3>
<table style="width: 100%;">
 <tbody>
  <tr>
   <td style="width: 75%;">
            <iframe id="PressFrame" src="http://172.16.5.31/cgi-bin/rrd_graph_press?_start_val=end-1w&_width=700&_height=300"
                    height="350" width="700" border="0" marginwidth="0" style="border:none;" frameborder="0">
                      <script>
                         window.setInterval("reloadIFrame();", 60000);
                         function reloadIFrame() {
                           document.getElementById("PressFrame").src="http://172.16.5.31/cgi-bin/rrd_graph_press?_start_val=end-1w&_width=700&_height=300";
                         }
                      </script>
           </iframe>
           <iframe id="TempFrame" src="http://172.16.5.31/cgi-bin/rrd_graph_temp?_start_val=end-2d&_width=700&_height=300"
                   height="350" width="700" border="0" marginwidth="0" style="border:none;" frameborder="0">
                     <script>
                       window.setInterval("reloadIFrame();", 60000);
                         function reloadIFrame() {
                           document.getElementById("TempFrame").src="http://172.16.5.31/cgi-bin/rrd_graph_temp?_start_val=end-2d&_width=700&_height=300";
                         }
                    </script>
           </iframe>
   </td>
   <td style="width: 25%; vertical-align: top;" rowspan="3">

   </td>
  </tr>
  <tr>
   <td style="width: 75%;">
            <iframe src="http://172.16.5.31/freeboard_n/index-dev.html" height="480" width="1400"
                    border="0" marginwidth="0" style="border:none;" frameborder="0"></iframe>
   </td>
  </tr>
  <tr>
   <td style="width: 75%;">
            <iframe src="http://172.16.5.31/freeboard_n/index-dev.html" height="480" width="1400"
                    border="0" marginwidth="0" style="border:none;" frameborder="0"></iframe>

   </td>
  </tr>
 </tbody>
</table>

</BODY>
</HTML>
Someone may notice that the charts are not rendered by FREEBOARD, but by an RRDTool bash script that is launched as a cgi-bin application. Since the charting widgets available under FREEBOARD are based on JQUERY libraries such as JQPLOT and others and they are as clumsy as RRDGraph, and since the data is kept into RRD databases, it is anyway better to render them by using the RRDTool utilities. The RRD charts are rendered “on the fly”, without storing them on a server’s file.
This is an example of the bash CGI-BIN script:
#!/bin/bash
# url with parms http://xxx.yyy/cgi-bin/rrd_graph_temp?parm1=value1&parm2=value2&parmx=valuex
#
# Parameters Variables follows:
_start_val="end-1d"
_width=1024
_height=350
_canv_col="#2A2A2A"
_back_col="#2A2A2A"
_font_col="#FFFFFF"
_grid_col="#d8d8d8"
_mgrid_col="#FFFFFF"
_axis_col="#FF0000"
_arrw_col="#FF0000"
_shda_col="#2A2A2A"
_shdb_col="#2A2A2A"
_lin1_col="#5495ff"
_lin2_col="#00CC00"
# end of Parameter variables
if [[ ! -z "$QUERY_STRING" ]]; then
        saveIFS=$IFS
        IFS='&'
        eval $QUERY_STRING
        IFS=$saveIFS
      fi
# echo $parm1 $parm2
printf 'content-type: image/png\n\n'

IMG= /usr/bin/rrdtool graph - \
--start  ${_start_val} \
--width  ${_width} \
--height  ${_height} \
--color CANVAS${_canv_col} \
--color BACK${_back_col} \
--color FONT${_font_col} \
--color GRID${_grid_col} \
--color MGRID${_mgrid_col} \
--color AXIS${_axis_col} \
--color ARROW${_arrw_col} \
--color SHADEA${_shda_col} \
--color SHADEB${_shdb_col} \
--title 'AMBIENT INFO' \
--y-grid 2:1 \
--vertical-label 'Temp in °C  Humi in %rRH' \
--full-size-mode \
--units=si \
--slope-mode \
'DEF:HUMI=/etc/webmin/sysstats/modules/ENV_Temperatures/4.rrd:total:AVERAGE' \
'DEF:TEMP=/etc/webmin/sysstats/modules/ENV_Temperatures/1.rrd:total:AVERAGE' \
'VDEF:HUMI_LAST=HUMI,LAST' \
'VDEF:HUMI_MIN=HUMI,MINIMUM' \
'VDEF:HUMI_AVG=HUMI,AVERAGE' \
'VDEF:HUMI_MAX=HUMI,MAXIMUM' \
'VDEF:TEMP_LAST=TEMP,LAST' \
'VDEF:TEMP_MIN=TEMP,MINIMUM' \
'VDEF:TEMP_AVG=TEMP,AVERAGE' \
'VDEF:TEMP_MAX=TEMP,MAXIMUM' \
TEXTALIGN:left \
COMMENT:'                      ' \
COMMENT:'Last      ' \
COMMENT:'Minimum   ' \
COMMENT:'Average   ' \
COMMENT:'Maximum   \n' \
LINE2:HUMI$_lin1_col:Humidity \
COMMENT:'          ' \
GPRINT:HUMI_LAST:'%2.1lf %%RH  ' \
GPRINT:HUMI_MIN:'%2.1lf %%RH  ' \
GPRINT:HUMI_AVG:'%2.1lf %%RH  ' \
GPRINT:HUMI_MAX:'%2.1lf %%RH  \n' \
LINE2:TEMP${_lin2_col}:Temperature \
COMMENT:'       ' \
GPRINT:TEMP_LAST:'%2.2lf °C  ' \
GPRINT:TEMP_MIN:'%2.2lf °C  ' \
GPRINT:TEMP_AVG:'%2.2lf °C  ' \
GPRINT:TEMP_MAX:'%2.1lf °C   \n'

cat $IMG
Two different configuration files are set aside to be loaded in each FREEBOARD iframe:
The bottom line is that the dashboard look even nicer and it is now more manageable, from the FREEBOARD point of view.
USING DYNAMIC GAUGES
By observing the JSON Configurations, someone may have noticed the use of DYNAMIC GAUGES. They belong to an installable plug-in widget available here:
or here:
window.dyngaugeID = 0;
(function() {
    var dynamicGaugeWidget = function (settings) {
        var self = this;
        var thisDynGaugeID = "dyngauge-" + window.dyngaugeID++;
        var titleElement = $('<h2 class="section-title"></h2>');
        var gaugeElement = $('<div id="' + thisDynGaugeID + '"></div>');

        var gaugeObject;
        var rendered = false;

        var currentSettings = settings;
        var currentValues = {
            value: 0,
            min_value: 0,
            max_value: 0,
            level_colors: ['#f45b5b', '#f9c802', '#a9d70b', '#55BF3B'],
        };

        function createGauge() {
            if (!rendered) {
                return;
            }

            gaugeElement.empty();

            gaugeObject = new JustGage({
                id: thisDynGaugeID,
                value: currentValues.value,
                min: currentValues.min_value,
                max: currentValues.max_value,
                label: currentSettings.units,
                showInnerShadow: false,
                valueFontColor: "#d3d4d4",
                levelColors: currentValues.level_colors,
            });
        }

        this.render = function (element) {
            rendered = true;
            $(element).append(titleElement).append($('<div class="gauge-widget-wrapper"></div>').append(gaugeElement));
            createGauge();
        }

        this.onSettingsChanged = function (newSettings) {
            if (newSettings.units != currentSettings.units) {
                currentSettings = newSettings;
                createGauge();
            }
            else {
                currentSettings = newSettings;
            }

            titleElement.html(newSettings.title);
        }

        this.onCalculatedValueChanged = function (settingName, newValue) {
            currentValues[settingName] = newValue;
            if (!_.isUndefined(gaugeObject)) {
                if (settingName == 'value') {
                    gaugeObject.refresh(Number(newValue));
                } else {
                    createGauge();
                }
            }
        }

        this.onDispose = function () {
        }

        this.getHeight = function () {
            return 3;
        }

        this.onSettingsChanged(settings);
    };

    freeboard.loadWidgetPlugin({
        type_name: "dyngauge",
        display_name: "DynamicGauge",
        "external_scripts" : [
            "/freeboard/plugins/thirdparty/raphael.2.1.0.min.js",
            "/freeboard/plugins/thirdparty/justgage.1.0.1.js"
// ----------------make sure the paths are correct ------------------
        ],
        settings: [
            {
                name: "title",
                display_name: "Title",
                type: "text"
            },
            {
                name: "value",
                display_name: "Value",
                type: "calculated"
            },
            {
                name: "units",
                display_name: "Units",
                type: "text"
            },
            {
                name: "min_value",
                display_name: "Minimum",
                type: "calculated",
                default_value: 0
            },
            {
                name: "max_value",
                display_name: "Maximum",
                type: "calculated",
                default_value: 100
            },
            {
                name: "level_colors",
                display_name: "Level colors",
                type: "calculated",
                default_value: "return ['#f45b5b', '#f9c802', '#a9d70b', '#55BF3B']"
            }
        ],
        newInstance: function (settings, newInstanceCallback) {
            newInstanceCallback(new dynamicGaugeWidget(settings));
        }
    });

}());
This widget can be installed by GIT Cloning it into the third party “freeboard/plugins/thirdparty” directory, executing npm install into the directory, modifying the index html files and executing grunt:
# from within the freeboard directory:
cd ./plugins/thirdparty
git clone https://github.com/bumbu/freeboard-plugins.git
npm install
cd ../..
# edit index.html and index-dev.html this way:
#------------------------------------------------------------------
#                     ...
#   <script src="js/freeboard.thirdparty.min.js"></script>
#     <script type="text/javascript">
#         head.js("js/freeboard_plugins.min.js",
#+		"plugins/thirdparty/gauge.js",     (add this line)
#                 // *** Load more plugins here ***
#                 function(){
#                     $(function()
#                     { //DOM Ready
#                        freeboard.initialize(true);
#                     ...
#------------------------------------------------------------------
# then run grunt
grunt